Malaysia entered the Southwest Monsoon on 14 May 2026. MetMalaysia expects the season to continue until September, with lower rainfall totals, more dry days than rainy days, and higher haze risk during the July–September peak if open burning is not controlled (Jabatan Meteorologi Malaysia, 2026a).
Dry months change how public spaces should be judged. A park edge, bus stop, campus route or plaza may look green in photographs and still fail under midday exposure. The design question is whether people can walk, wait and rest without unnecessary heat stress.
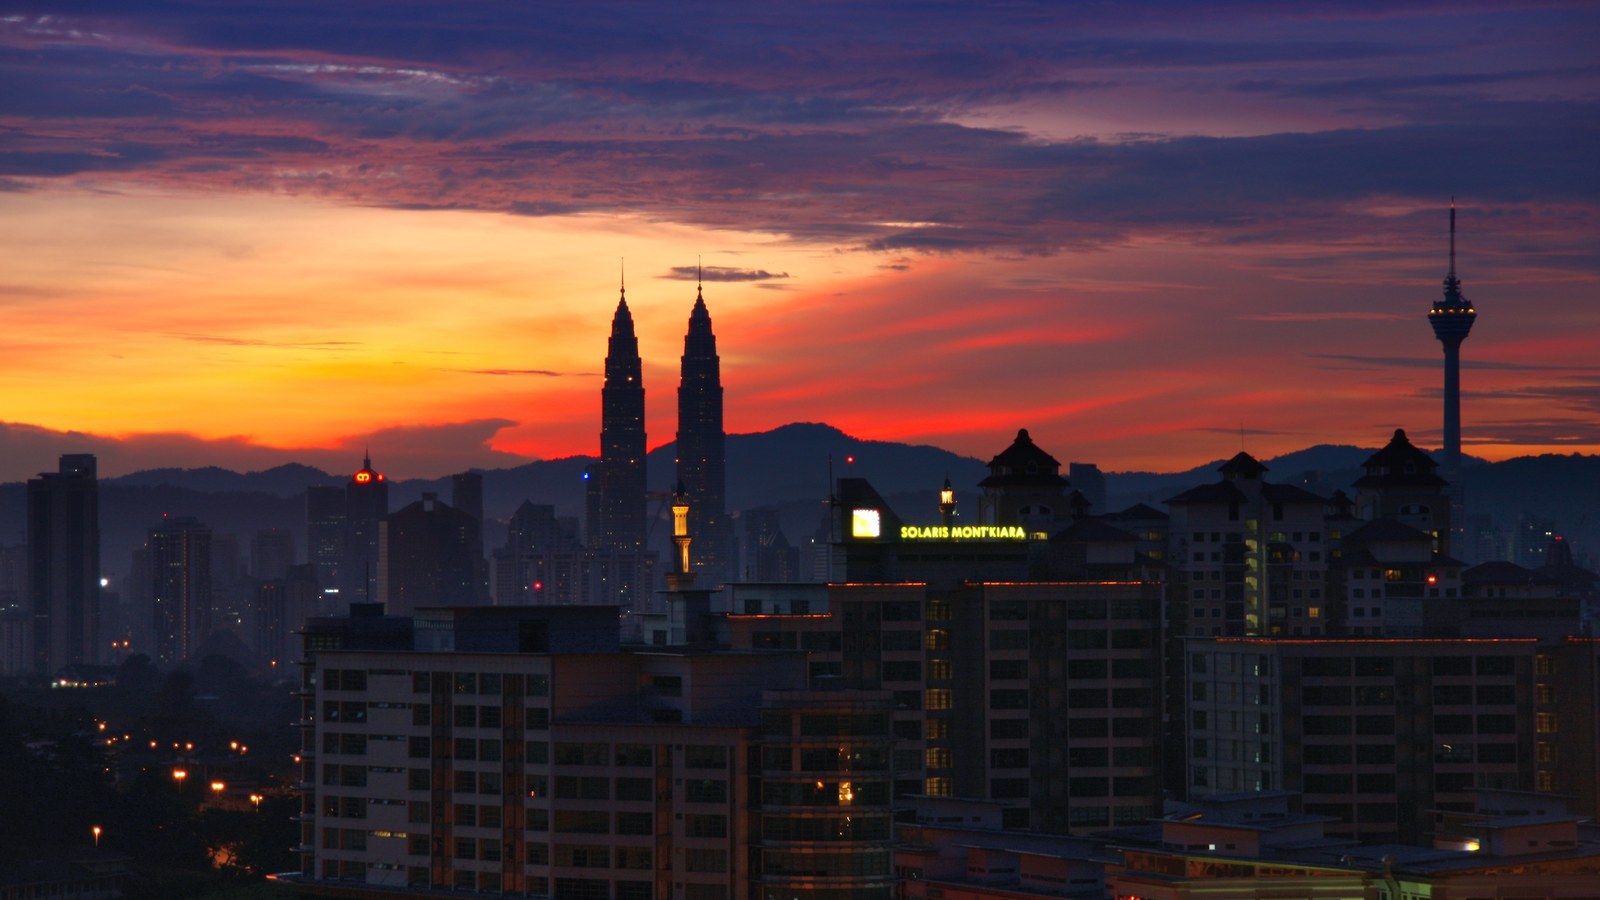
Cover image. Kuala Lumpur sunrise city skyline with Petronas Towers and KL Tower. Photo by Marek Ślusarczyk (Tupungato), Wikimedia Commons, CC BY 3.0. Cropped for web use.

Greater KL already shows a hotter surface pattern
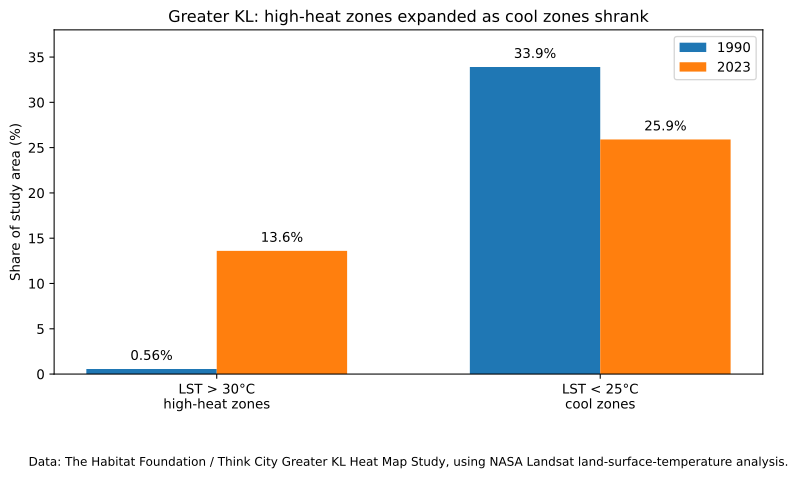
The Greater Kuala Lumpur Heat Map Study by The Habitat Foundation and Think City uses NASA Landsat land-surface-temperature data to compare Greater KL from 1990 to 2023 (The Habitat Foundation, 2026).
In 1990, 0.56% of the study area recorded land surface temperature above 30°C. By 2023, the share had increased to 13.6%. Over the same period, cooler zones below 25°C fell from 33.9% to 25.9% (The Habitat Foundation, 2026).
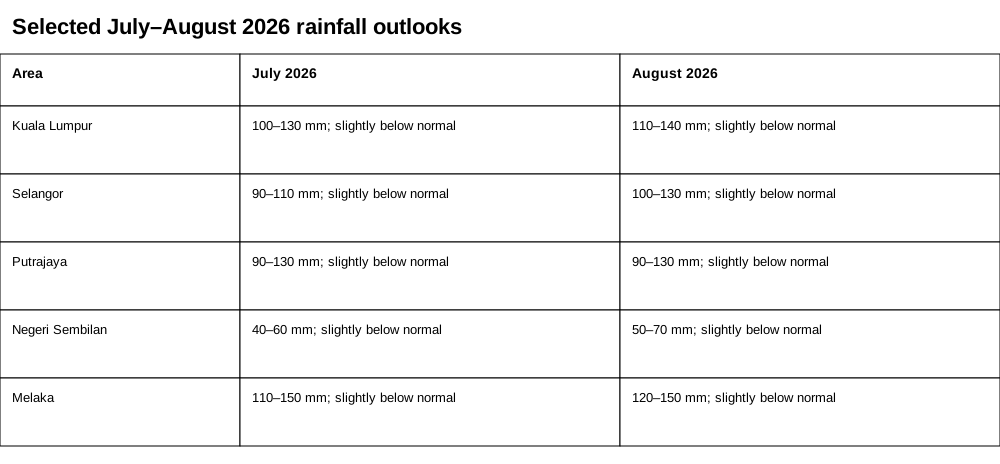
The seasonal outlook adds short-term pressure. MetMalaysia classifies July and August 2026 rainfall for Kuala Lumpur as slightly below normal. Selangor, Putrajaya, Negeri Sembilan and Melaka receive the same July–August classification (Jabatan Meteorologi Malaysia, 2026a).
The ASEAN Specialised Meteorological Centre projects below-normal rainfall over the southern ASEAN region for June–August 2026 and above-normal temperature over most of ASEAN. It also expects hotspot and smoke-haze activity to increase as the southern ASEAN region enters its traditional dry season, with further intensification possible if El Niño conditions develop (ASEAN Specialised Meteorological Centre, 2026).
Heat risk is not limited to official heatwave thresholds
The Ministry of Health Malaysia reported 56 heat-related illness cases from 1 January to 3 May 2026: 47 heat-exhaustion cases, four exertional heat-stroke cases, four heat-stroke cases and one heat-cramp case. Two deaths from heat stroke were also reported. The ministry noted that 58% of the cases were associated with physical activity during hot weather (Kementerian Kesihatan Malaysia, 2026).
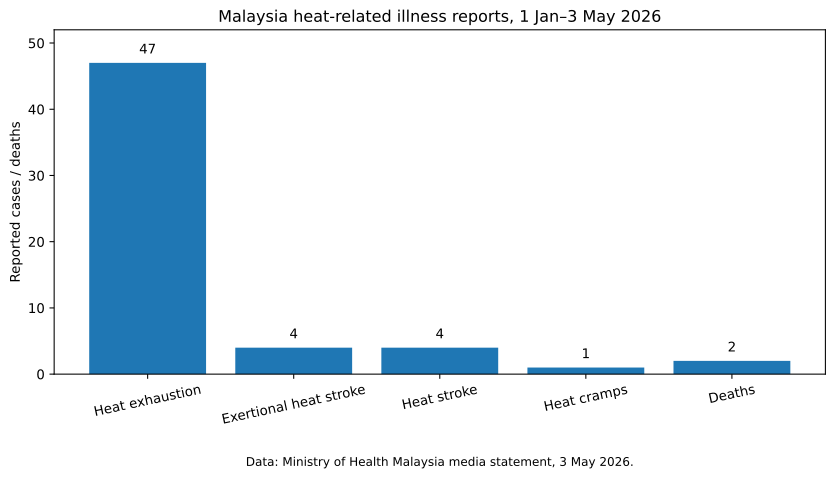
Both reported deaths occurred when conditions were below Heat Alert Level 1 (Kementerian Kesihatan Malaysia, 2026). For public-space design, this matters. Local exposure can still be severe where people walk across open pavement, wait beside traffic, work outdoors or have no shaded place to rest.
Shade changes pedestrian exposure
As Gatto Land noted in Shade Is Usability Infrastructure: What Malaysian Campus Studies Show, shade only works when it follows the walking and waiting line. The same principle applies beyond campus: bus stops, crossings, school routes, market edges and neighbourhood parks all depend on continuous shade where people actually move.
A UPM field study measured five pedestrian walkway settings in a tropical campus environment: no shade, metal deck shade, one row of trees, combined deck-and-tree shade, and two rows of trees. Measurements were taken from 12:00 to 15:00 and included air temperature, surface temperature, humidity, wind velocity, globe temperature, mean radiant temperature and Physiological Equivalent Temperature, or PET (Kasim et al., 2019).
Compared with the no-shade walkway, two rows of trees reduced mean air temperature by 1.8°C, mean surface temperature by 6.9°C and mean PET by 6.74°C. In the no-shade condition, mean surface temperature was 40.7°C. Under two rows of trees, it was 33.8°C (Kasim et al., 2019).
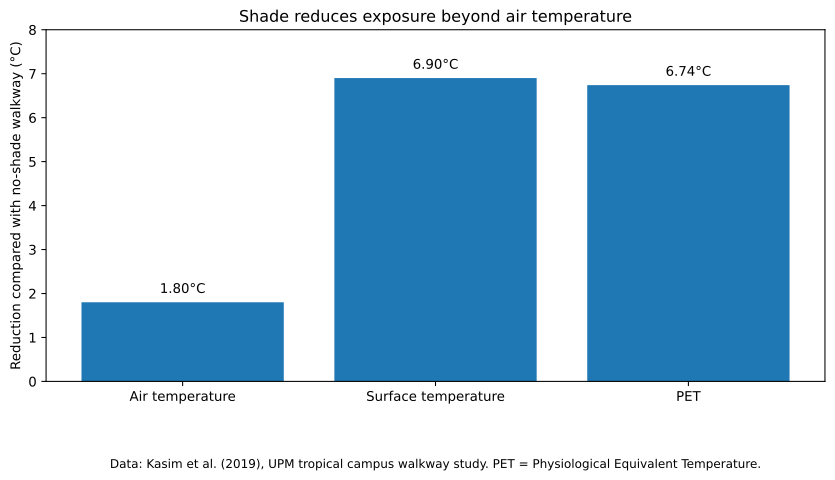
The air-temperature reduction was modest; the surface-temperature and PET reductions were larger. Public-space design should therefore treat radiant heat, surface heat and shade continuity as core performance measures, not secondary details.
Green-blue infrastructure has measurable cooling value
Shade is the first layer. It is not the only layer.
A systematic review by Kumar et al. (2024) screened 27,486 papers and reviewed 202 studies on green-blue-grey infrastructure. The strongest average air-cooling effects among reviewed types were reported for botanical gardens, wetlands, green walls, street trees and vegetated balconies. These figures are global review estimates, not Malaysian site guarantees, but they identify the mechanisms that matter: shade, evapotranspiration, surface replacement and connected vegetated or water-sensitive space.
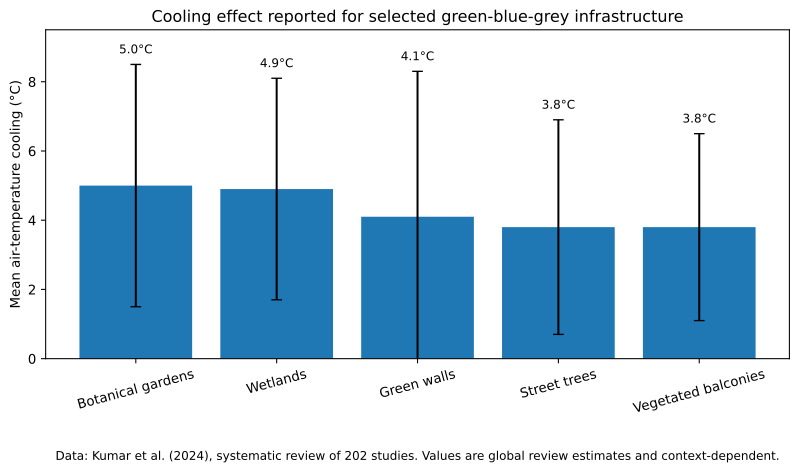
For Malaysian public spaces, the implication is not to copy every intervention. The point is to place the right cooling type where it fits the urban condition. Large green spaces and wetlands matter at park, river and drainage-corridor scales. Street trees and shaded walkways matter along movement lines. Green walls and vegetated edges can help where ground space is constrained. Rain gardens and vegetated swales can support cooling while also improving stormwater handling during tropical rainfall.
A recent Kuala Lumpur study in Planning Malaysia supports this direction. Field measurements across Kampung Baru, Bukit Bintang and KLCC Park found that compact urban districts experience elevated temperatures and reduced ventilation, while vegetated and water-adjacent areas provide notable cooling. The study identifies green infrastructure, reflective materials and passive design as mitigation strategies for dense tropical districts (Mohd-Sahabuddin et al., 2025).
Bus stops are heat-exposure nodes
Bus stops should not be treated as small objects placed beside roads. They are heat-exposure nodes in a walking network.
A Phoenix study found that almost half of surveyed bus-stop users felt hot or very hot, more than half felt thermally uncomfortable, and shade reduced PET by an average of 19°C at bus stops (Dzyuban et al., 2022). A Houston study found that tree-shaded areas at bus stops were 3.2°C cooler than unshaded areas, while unshaded enclosed shelters could increase heat stress by more than 3°C compared with unshaded areas outside the shelter (Lanza et al., 2025).
These findings are important for Malaysia because the hot part of a transit trip is not only the waiting time. It includes the walk to the stop, the crossing, the queue, the shelter, and the final 200–500 metres to the destination. A bus shelter with no shaded approach is incomplete. A shaded shelter that traps heat is also incomplete.
From evidence to public-space priorities
The World Bank’s Handbook on Urban Heat Management in the Global South frames urban heat as a health, labour, infrastructure and inequality risk, and highlights green infrastructure, passive cooling and sustainable cooling systems as city-level responses (World Bank, 2025). For Malaysian public spaces, those ideas can be translated into a narrower landscape hierarchy.
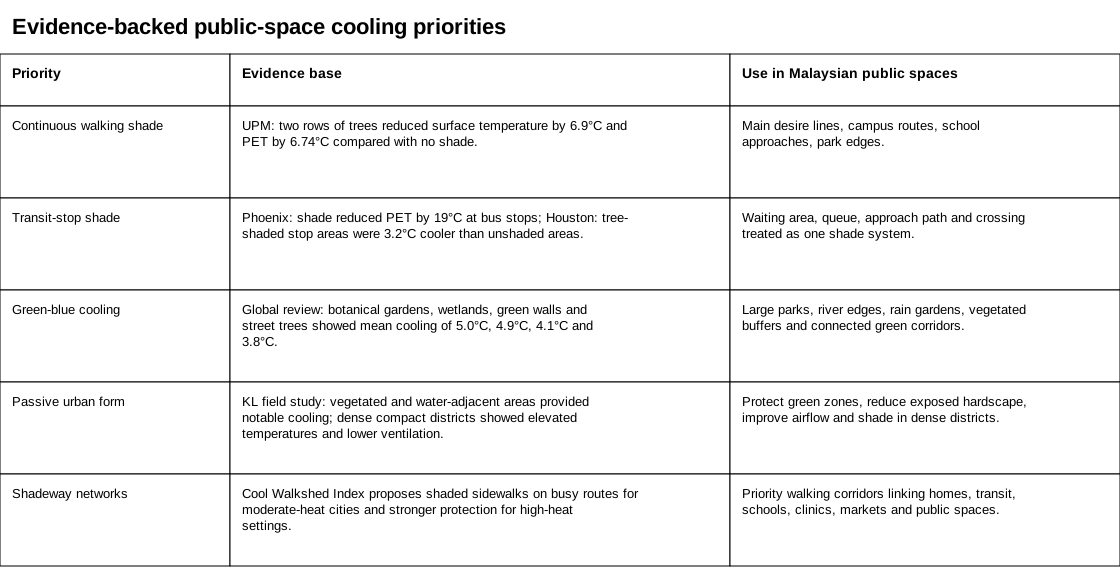
The hierarchy is simple.
First, protect and extend shaded walking routes. This is the highest priority because walking exposure accumulates along the route, not only at the destination.
Second, retrofit bus stops and crossings as complete shade systems. The waiting zone, queue space, approach path and road-crossing point should be designed together.
Third, connect green-blue cooling patches. Parks, river corridors, rain gardens, wetlands, drainage reserves and tree-lined streets should work as a cooling network rather than isolated visual greenery.
Fourth, manage surface heat. Exposed hardscape should be reduced where people walk and wait. Reflective or cooler materials can help, but they do not replace shade.
Fifth, design planting to survive. Trees need soil volume, rooting space, water access, drainage and establishment care. Failed planting is not green infrastructure.
The dry-season public-space test
| Element | Test |
|---|---|
| Walking route | Is the main desire line shaded during late morning and afternoon? |
| Bus stop | Are the waiting area, queue, approach path and crossing shaded as one system? |
| Seating | Can people rest without sitting in direct sun or beside hot pavement? |
| Green-blue network | Are parks, river edges, rain gardens and tree corridors connected enough to cool daily routes? |
| Pavement | Has exposed hardscape been reduced where people walk and wait? |
| Planting | Are trees given soil volume, water access, drainage and establishment care? |
| Haze-risk period | Are shorter, shaded and lower-exertion routes available? |
This test avoids decorative greening. It asks whether the public realm lowers exposure where people actually use it.
Conclusion
Malaysia’s 2026 Southwest Monsoon makes one public-space priority difficult to ignore: shade before beautification.
The evidence points to a practical design order. Map the heat pattern. Shade the walking and waiting line. Use green-blue infrastructure where it can cool, drain and connect. Treat bus stops as exposure nodes. Reduce hardscape heat. Keep trees alive long enough to become canopy.
A climate-responsive public space is not defined by how green it looks. It is defined by whether shade, surface materials, planting systems and rest points reduce exposure during the hot, dry and haze-risk months when people need that performance most.
References
ASEAN Specialised Meteorological Centre. (2026). Seasonal forecast for June–August 2026. https://asmc.asean.org/asmc-seasonal-outlook/
Dzyuban, Y., Hondula, D. M., Coseo, P. J., & Redman, C. L. (2022). Public transit infrastructure and heat perceptions in hot and dry climates. International Journal of Biometeorology, 66, 345–356. https://doi.org/10.1007/s00484-021-02074-4
Gatto Land. (2026, April 17). Shade is usability infrastructure: What Malaysian campus studies show. https://gatto.land/p/shade-usability-infrastructure-malaysian-campus-studies/
Gibbons, K. (2026, May 26). We’ve been looking at heat wrong and it’s killing us. The Dirt, American Society of Landscape Architects. https://www.asla.org/news-insights/dirt/we%E2%80%99ve-been-looking-at-heat-wrong-and-it%E2%80%99s-killing-us
Jabatan Meteorologi Malaysia. (2026a). Long-range weather outlook from June to November 2026. https://www.met.gov.my/data/climate/tinjauancuacajangkapanjang_en.pdf
Jabatan Meteorologi Malaysia. (2026b). Weather phenomena: Characteristics of monsoon. https://www.met.gov.my/en/pendidikan/fenomena-cuaca/
Kasim, Z., Shahidan, M. F., Ujang, N., & Dahlan, N. D. (2019). Influence of landscape environmental settings on outdoor pedestrian thermal comfort in tropical climate. Alam Cipta, 12(2), 73–84. https://spel2.upm.edu.my/webupm/upload/dokumen/20191231083712Paper_8_Dec_2019.pdf
Kementerian Kesihatan Malaysia. (2026, May 3). Nasihat penjagaan kesihatan semasa cuaca panas. https://www.moh.gov.my/images/kenyataan-media/2026/MEI%202026/KENYATAAN%20MEDIA%20CUACA%20PANAS%20.pdf
Kumar, P., Debele, S. E., Khalili, S., Halios, C. H., Sahani, J., Aghamohammadi, N., Andrade, M. D. F., Athanassiadou, M., Bhui, K., Calvillo, N., Cao, S. J., Coulon, F., Edmondson, J. L., Fletcher, D., Dias de Freitas, E., Guo, H., Hort, M. C., Katti, M., Kjeldsen, T. R., … Jones, L. (2024). Urban heat mitigation by green and blue infrastructure: Drivers, effectiveness, and future needs. The Innovation, 5(2), Article 100588. https://doi.org/10.1016/j.xinn.2024.100588
Lanza, K., Ernst, S., Watkins, K., & Chen, B. (2025). Heat stress mitigation by trees and shelters at bus stops. Transportation Research Part D: Transport and Environment, 140, Article 104653. https://doi.org/10.1016/j.trd.2025.104653
Li, Y., Schubert, S., Kropp, J. P., & Rybski, D. (2024). Green spaces provide substantial but unequal urban cooling globally. Nature Communications, 15, Article 7108. https://doi.org/10.1038/s41467-024-51355-0
Litman, T. (2023). Cool walkability planning: Providing pedestrian thermal comfort in hot climate cities. Journal of Civil Engineering and Environmental Sciences, 9(2), 079–086. https://doi.org/10.17352/2455-488X.000073
Mohd-Sahabuddin, M. F., Chinn, L. X., & Aduldejcharas, R. (2025). Urban morphology and passive design: Strategies to mitigate urban heat island and improve thermal comfort in Kuala Lumpur. Planning Malaysia, 23(38). https://doi.org/10.21837/pm.v23i38.1808
The Habitat Foundation. (2026). Heat map study of Greater Kuala Lumpur. https://www.habitatfoundation.org.my/heat-map-study-of-greater-kuala-lumpur/
World Bank. (2025). Handbook on urban heat management in the Global South. https://www.worldbank.org/en/topic/urbandevelopment/publication/handbook-on-urban-heat-management-in-the-global-south
World Health Organization. (2026). Heat and health. https://www.who.int/news-room/fact-sheets/detail/climate-change-heat-and-health
World Meteorological Organization. (2026). WMO: Prepare for El Niño. https://wmo.int/news/media-centre/wmo-prepare-el-nino